Most humanitarian decisions start with the same unglamorous task. Someone has to find the numbers.
How many people are in IPC Phase 3 or worse. How many are displaced inside the country. What the latest conflict fatality count looks like. What the population denominator is, so the percentage in your needs statement actually means something. Four questions, four portals, four different export formats, and a fair chance the figures were published in different months.
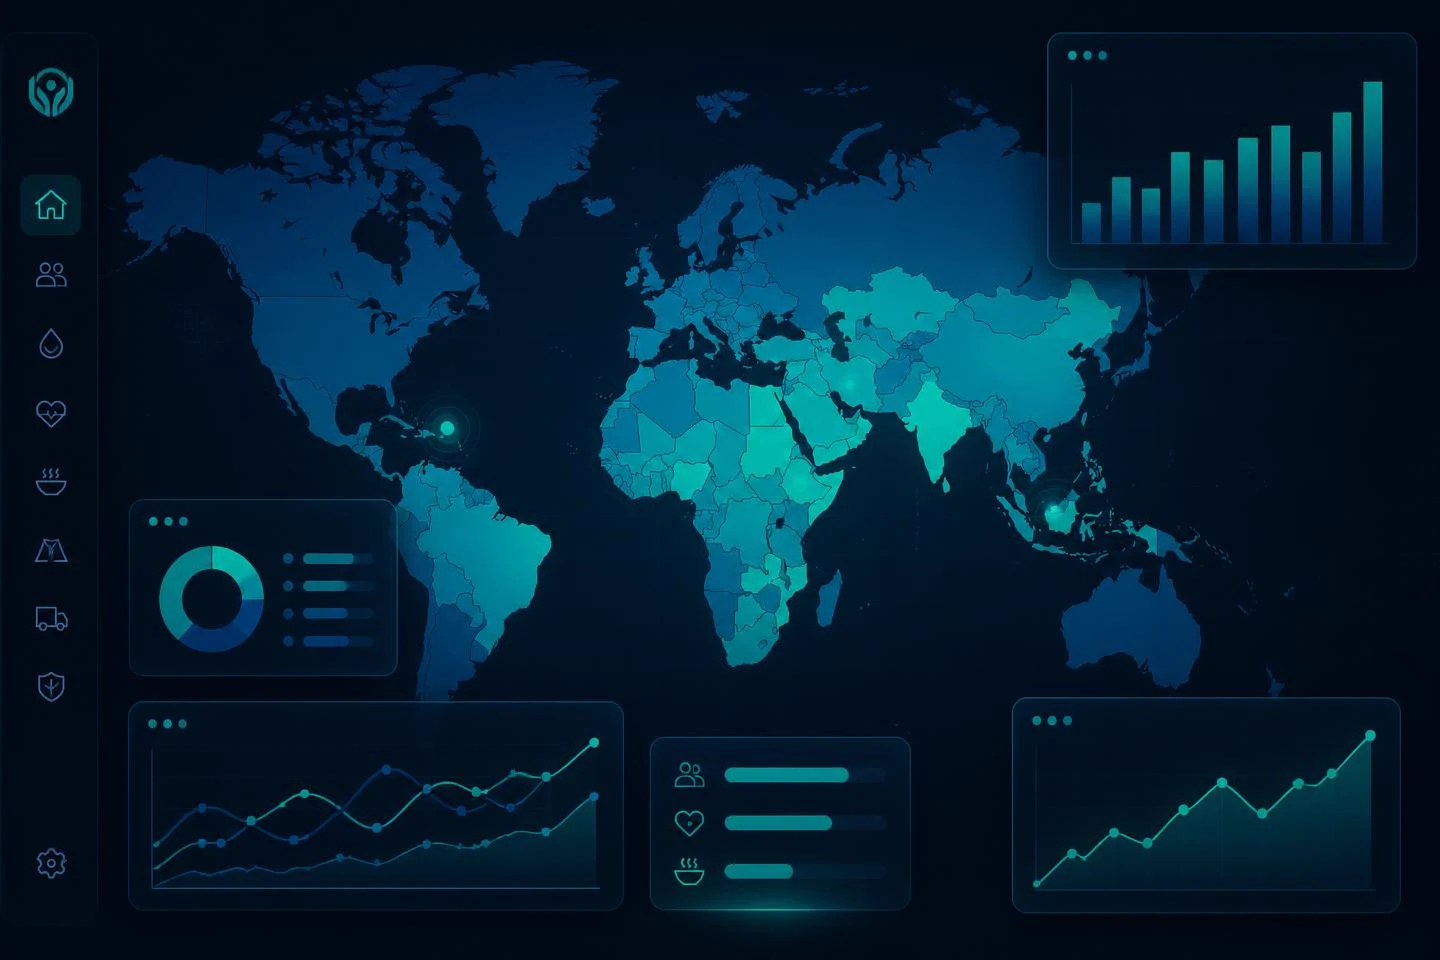
The Humanitarian Hub exists to remove that step. It is a free, map-first workspace that pulls live country data from the recognised sources into one screen, with an AI copilot sitting beside the map so you can ask questions about what you are looking at.
What the Hub actually is
One world map. One filter bar. One country drawer. One copilot.
You pick a data layer and the map colour-grades every country against it. You filter to a region if you only care about the Sahel or the Horn. You click a country and a drawer opens with the detail behind that shade. If something looks odd or you need it written up, you ask the copilot without leaving the page.
Nothing to install, no licence, no account needed to look at the map.
The six layers and what each one answers
Each layer is a live feed from the source the sector already trusts, not a Synergaid estimate.
Composite severity, Synergaid index. A blended score from 0 to 100 across all four data sources. Higher means greater overall pressure. Use it when you want the shortlist rather than a single metric.
Food insecurity, IPC/CH. The share of the population in IPC or CH Phase 3 or worse, which is crisis-level hunger and beyond. This is the layer that answers "where is the hunger worst right now".
People in need, OCHA HNO. The number assessed as needing humanitarian assistance in the latest Humanitarian Needs Overview. The figure donors recognise, because it is the figure they read in the appeal.
Internally displaced, IOM DTM. People displaced inside their own country, from IOM's Displacement Tracking Matrix. Useful for anything about movement, shelter or host-community pressure.
Conflict fatalities, ACLED. Deaths from recorded armed-conflict events across the recent reporting window. A blunt but fast read on deterioration.
Total population, UN and HDX HAPI. The denominator behind every other figure. Open a country for the age and gender breakdown, which is what turns a headline number into a targeting argument.
Five things an NGO team can do with it today
Draft a situation report in minutes rather than hours. Set the layer, click the country, read the drawer, ask the copilot to summarise the position. You still write the analysis. You stop spending the morning collecting inputs for it.
Write a needs statement that survives review. Grant assessors look for a defensible figure with a named source and a date. The Hub gives you the figure, the source and the reporting window in the same view, so the citation writes itself.
Shortlist countries for a new response. Switch to composite severity, filter to the region you can realistically operate in, and read the ranked focus list. That is a defensible starting point for a board paper, not a hunch.
Brief a board or a donor with something they can see. The map is far easier to present than a spreadsheet. Every view is shareable, because the layer, region, country and search all live in the page address. Set up the view you want, copy the link, paste it into the paper.
Monitor the countries you already work in. Check the same country and layer each week. When the shade moves, you know before the next cluster meeting does.
How to use it in about five minutes
- Open the Humanitarian Hub.
- Pick a layer in the filter bar. Start with composite severity for the overview or food insecurity for a single clear question.
- Narrow to a region if you have a geographic focus.
- Click a country on the map, or search for it, to open the country drawer.
- Ask the copilot what you want to know about the country in front of you.
- Copy the address bar to share the exact view with a colleague.
The honest limits
Two things worth stating plainly, because a tool that oversells itself is worse than no tool.
First, the Hub is only as current as the upstream sources. IPC analyses, HNO figures and DTM rounds all have their own publication cycles, and some countries are updated far less often than others. The Hub shows you what the source says. It does not manufacture a figure where the source has none.
Second, the layers are not additive. People in need, displaced people and people in IPC Phase 3 overlap heavily, and the same person is often counted in more than one. Adding them together produces a number that is both larger and less true. The Hub carries that warning on screen for the same reason it appears here.
Neither limit is a reason to go back to four browser tabs. They are the reason to read the map as a starting point for analysis rather than as the analysis itself.
Why we built it
Synergaid works with humanitarian and nonprofit teams on the unglamorous middle layer, the systems and processes that sit between good intent and delivered work. Data collection is one of the clearest examples of avoidable admin in the sector. The information is public, the sources are respected, and thousands of people still copy it by hand into documents every week.
Less admin, more impact is not a slogan we can only apply to other people's workflows. The Hub is that principle applied to the one task nearly every humanitarian role shares.
Open the Humanitarian Hub and try it against a country you know well. If the figures match what you already understand about that context, you can trust it for the ones you do not. You can find the rest of what we have built on the tools page, and the vetted third-party material we recommend in the resources library.
Related Resources
AllyGPT - AI Assistant
Your AI ally for humanitarian work
Our Services
Explore our technology solutions for humanitarian organisations
Keep reading
About the author
Synergaid supports humanitarian organisations with practical systems, clear processes and honest advice.